British and Commonwealth arms production in WW2 from 1939-1945.
British arms production in WW2
Table of Contents
During World War II, British arms production played a crucial role in the war effort. The United Kingdom was one of the major Allied powers, and its industrial capacity was essential in supplying weapons, ammunition, and equipment to its own forces and those of its allies.
Overview
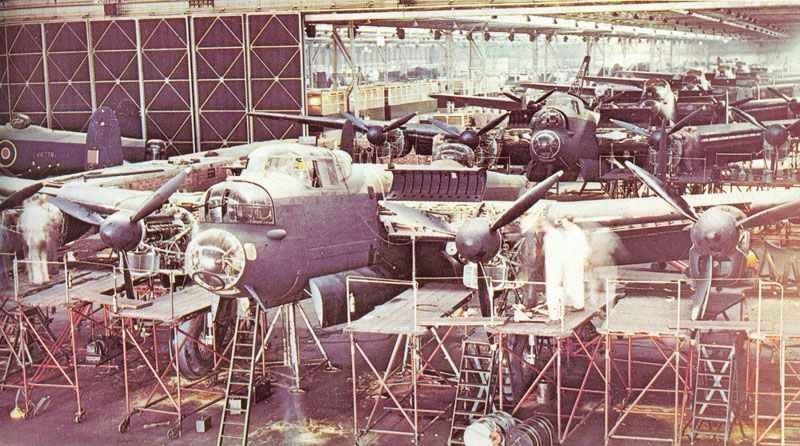
Rapid industrialization: Britain quickly mobilized its industries to meet the demands of war production, with many factories converting from civilian to military production.
Key weapon systems: British factories produced a wide range of weapons, including aircraft (Spitfire, Hurricane, Lancaster bomber), tanks (Cromwell, Churchill), small arms (Sten gun, Lee-Enfield rifle), and artillery pieces.
Naval production: British shipyards built and maintained a vast naval fleet, including battleships, cruisers, destroyers, and submarines.
Lend-Lease: Britain also received substantial material support from the United States through the Lend-Lease program, which provided essential raw materials, machinery, and finished products.
Innovation: British scientists and engineers developed several groundbreaking technologies during the war, such as radar, sonar, and the cavity magnetron (crucial for radar development).
Challenges: Despite its industrial might, Britain faced challenges such as labor shortages, raw material scarcity, and the threat of German bombing raids on factories and infrastructure or U-boats threatening the shipping routes.
Commonwealth contribution: Other nations in the British Commonwealth, such as Canada and Australia, also made significant contributions to the war effort through arms production and resource sharing.
British arms production, combined with the efforts of its allies, played a vital role in the eventual Allied victory in World War II, demonstrating the nation’s resilience and industrial prowess during one of the most challenging periods in its history.
British arms production by weapon types
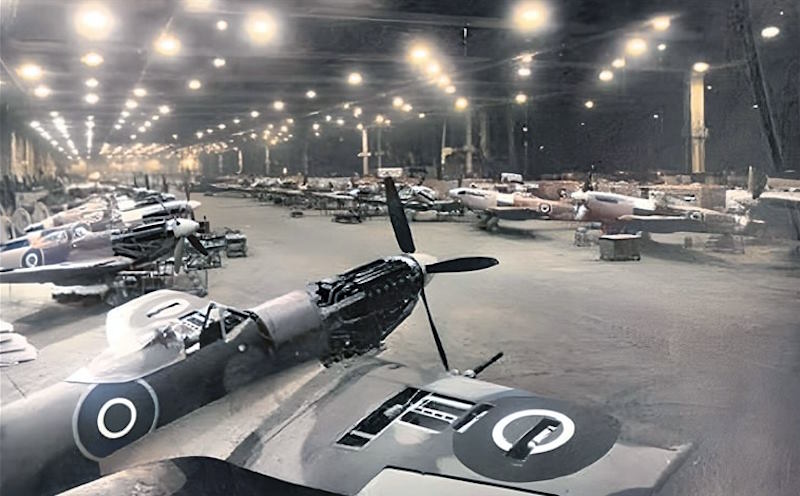
Following are tables of the British and Commonwealth armaments and military equipment production (excluding ammunition) and a comparison of the necessary strategic raw materials.
The British annual production figures of the main arms and military equipment (without ammunition) during WW2 from 1939-1945:
Arms Production:
Type of Weapon | 1939 | 1940 | 1941 | 1942 | 1943 | 1944 | 1945 | OVERALL |
|---|---|---|---|---|---|---|---|---|
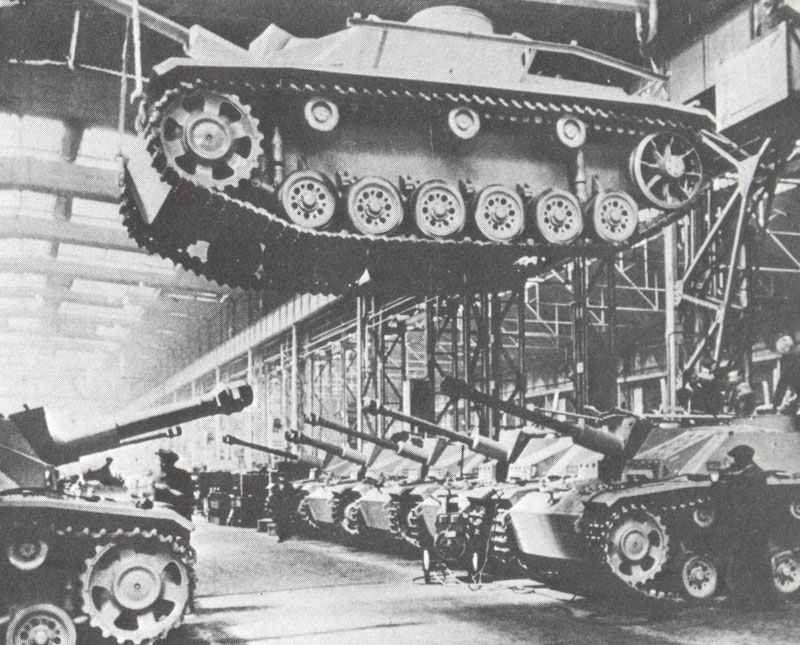
Tanks and Self-propelled guns | 969 | 1,399 | 4,841 | 8,611 | 7,476 | 4,600 | ? | 27,896 |
Artillery (including anti-tank and anti-aircraft guns) | 538 | 4,700 | 16,700 | 43,000 | 38,000 | 16,000 | 5,939 | 124,877 |
Mortars | 102,950 (1939-45) | ? | ? | ? | ? | ? | ? | 102,950 |
Machine-guns (without sub-machine guns) | 297,336 (1939-45) | ? | ? | ? | ? | ? | ? | 297,336 |
Rifles | 1,000,000+ (Lee-Enfield Nov 39-Sep 45; incl. Canada and US; 1939-45) | ? | ? | ? | ? | ? | ? | 5,000,000+ |
Sub-machine guns (Sten) | - | - | 2,000,000 + (incl. Canada c.40%; 1941-45) | ? | ? | ? | ? | 2,000,000+ |
Military trucks and lorries | ? | 89,582 | 88,161 | 87,499 | 113,912 | 54,615 | 47,174 | 480,943 |
Fighter planes | 1,324 | 4,283 | 7,064 | 9,849 | 10,727 | 10,730 | 5,445 | 49,422 |
Bomber planes | 1,837 | 3,488 | 4,668 | 6,253 | 7,728 | 7,903 | 2,812 | 34,689 |
Reconnaissance planes | 61 | 387 | 196 | 546 | 1,054 | 1,123 | 600 | 3,967 |
Transport planes | - | - | - | - | 209 | 889 | 686 | 1,784 |
Trainers and miscellaneous military types | 4,209 | 6,415 | 6,934 | 5,942 | 4,825 | 2,877 | 692 | 31,894 |
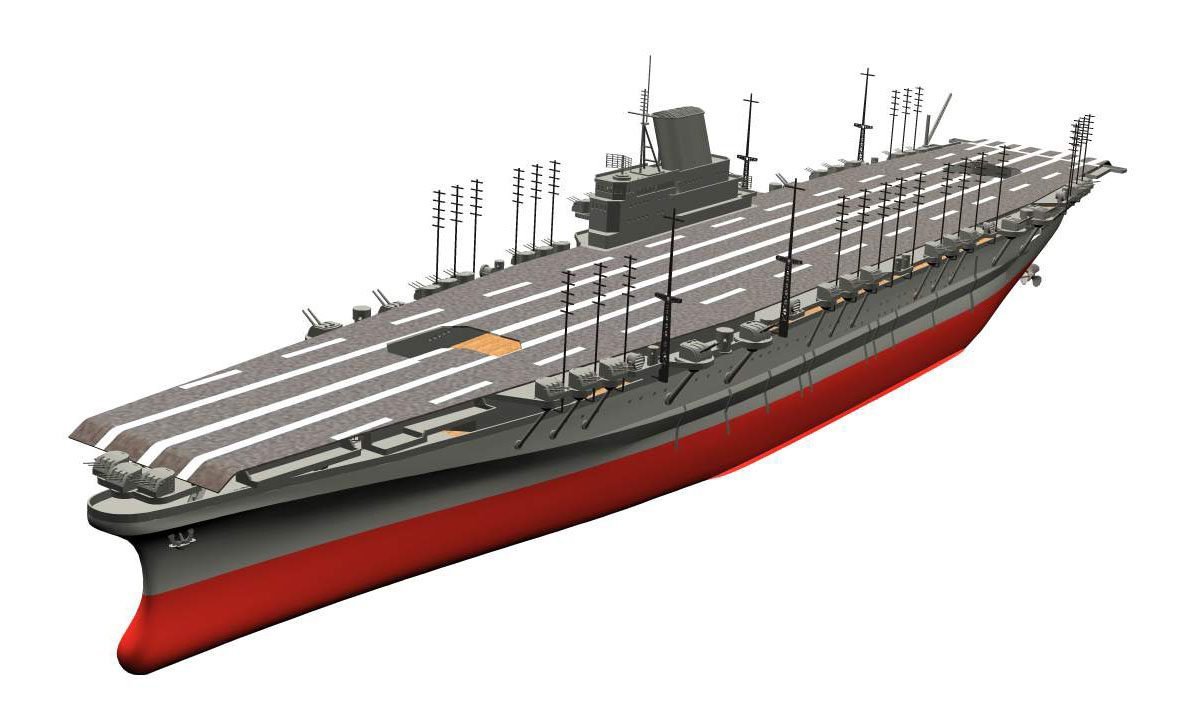
Aircraft carriers (all types) | - | 2 | 2 | - | 2 | 4 | 4 | 14 |
Battleships | - | 1 | 2 | 2 | - | - | - | 5 |
Cruisers | 3 | 7 | 6 | 6 | 7 | 2 | 1 | 32 |
Destroyers | 22 | 27 | 39 | 73 | 37 | 31 | 13 | 240 |
Escorts (Corvettes, Frigates) | 5 | 109 | 87 | 71 | 79 | 55 | 7 | 413 |
Submarines | 7 | 15 | 20 | 33 | 39 | 39 | 14 | 167 |
Merchant shipping tonnage | 629,705 | 842,910 | 1,185,894 | 1,270,714 | 1,136,804 | 919,357 | 393,515 | 6,378,899 |
Raw material production for the military weapon production above:
Annual strategic raw material production (m. metric tons):
Year: | 1939 | 1940 | 1941 | 1942 | 1943 | 1944 | 1945 |
|---|---|---|---|---|---|---|---|
Coal | 231.3 | 224.3 | 206.3 | 204.9 | 198.9 | 192.7 | 182.8 |
Ore | 14.5 | 17.7 | 19.0 | 19.9 | 18.5 | 15.5 | 14.2 |
Steel | 13.2 | 13.0 | 12.3 | 12.8 | 13.3 | 12.1 | 11.8 |
Aluminium (in 1,000 metric tons - especially important for aircraft production) | 25.0 | 18.9 | 22.7 | 46.8 | 55.7 | 35.5 | 31.9 |
Arms production in Commonwealth
Total numbers only for the arms’ production of the Commonwealth. There are no details about the annual production figures available except the merchant shipping tonnage.
Arms production in Commonwealth:
Type of weapon | Canada | Australia, New Zealand, India and South Africa | Overall |
|---|---|---|---|
Tanks and Self-propelled guns | 5,678 | 1,399 | 7,077 |
Artillery (including Anti-tank and anti-aircraft guns) | 10,552 | 4,700 | 15,252 |
Mortars | 20,619 | 25,395 | 46,014 |
Machine-guns (without sub-machine guns) | 251,925 | 37,983 | 289,908 |
Sub-machine guns | c.800,000 after June 1941 | ? | c.800,000 |
Trainers and Military planes of all sorts | 16,431 | 3,081 | 19,512 |
Escorts (Corvettes, Frigates) | 191 | 12 | 203 |
Merchant shipping tonnage:
1939 | 1940 | 1941 | 1942 | 1943 | 1944 | 1945 | OVERALL |
|---|---|---|---|---|---|---|---|
36,142 | 18,886 | 90,595 | 720,172 | 1,002,850 | 692,405 | 141,893 | 2,702,943 |
Production of strategic materials in Canada:
Annual strategic raw material production (m. metric tons):
Year: | 1939 | 1940 | 1941 | 1942 | 1943 | 1944 | 1945 |
|---|---|---|---|---|---|---|---|
Coal | 13.3 | 14.9 | 15.3 | 15.9 | 14.7 | 14.2 | 13.6 |
Ore | 0.1 | 0.4 | 0.5 | 0.5 | 0.6 | 0.5 | 1.0 |
Steel | 1.4 | 1.7 | 2.5 | 2.8 | 2.7 | 2.7 | 2.6 |
Important influences on Britain’s military production
Compared to the industrial potential and access to global resources of the UK, the military production of Britain failed surprisingly low in comparison to the other participating nations.
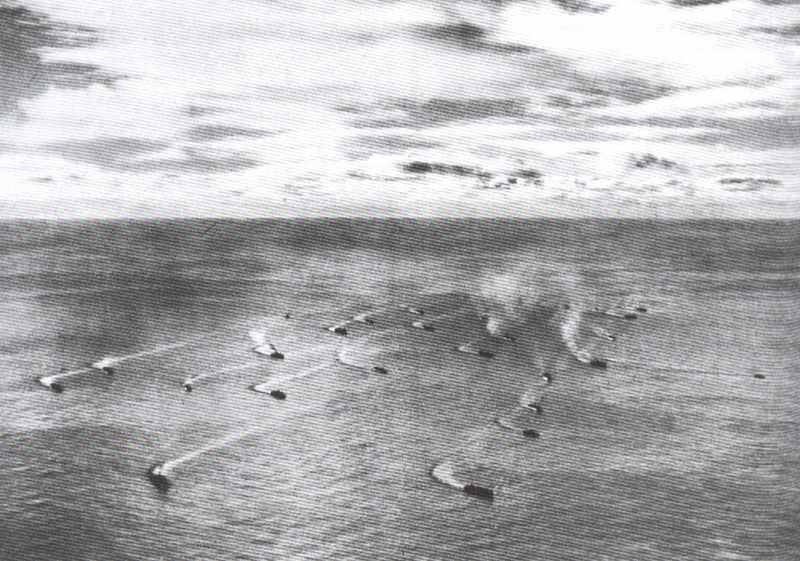
Some likely causes of the failures in its military production were the Battle of the Atlantic with its sea blockade, and the loss of a view of key areas of strategic raw materials (Malaya, Burma, South Pacific) to the Japanese in 1942.
Obviously, however, the US has taken-over the focus of the Anglo-American arms production – and probably so far as this can be taken from the imports of strategic raw materials to the UK, also to some part to the detriment of Britain. For example, the availability of important iron ore in the UK decreases from 1941 on by about 30% and is not increasing any more after the Battle of the Atlantic was won by the Allies from mid-1943.
Battle of the Atlantic
The war against the sea supply lines of Britain and the sea blockade:
Battle of the Atlantic:
Year: | 1938 | 1939 | 1940 | 1941 | 1942 | 1943 | 1944 | 1945 |
|---|---|---|---|---|---|---|---|---|
German U-boats losses | - | 9 | 22 | 35 | 85 | 287 | 241 | 70 (3 months) |
German U-boats construction | ? | 58 | 50 | 219 | 222 | 292 | 283 | 98 |
Average operational German U-boats per month | - | 29 | 28 | 50 | 316 | 423 | 457 | 470 |
Merchant ships sunk (in tons) | - | 810,000 | 4,407,000 | 4,398,000 | 8,245,000 | 3,611,000 | 1,422,000 | 458,000 |
thereof by U-boats | - | 452,000 | 2,415,000 | 2,203,000 | 6,629,000 | 2,900,000 | 1,052,000 | 294,000 |
Construction of merchant ships in UK incl Commonwealth (in tons) | ? | 231,000 | 780,000 | 815,000 | 1,843,000 | 2,201,000 | 1,170,000 | 283,000 |
Construction of merchant ships in US (in tons) | ? | 101,000 | 439,000 | 1,169,000 | 5,339,000 | 12,384,000 | 11,639,000 | 3,551,000 |
Total construction of Allied merchant ships (in tons) | ? | 332,000 | 1,219,000 | 1,984,000 | 7,182,000 | 14,585,000 | 13,349,000 | 3,834,000 |
Estimated total number of Allied merchant ships (in tons) | 34,500,000 | 34,123,000 | 30,935,000 | 28,521,000 | 27,458,000 | 38,432,000 | 48,359,000 | 51,735,000 |
British imports

Annual UK imports of key strategic raw materials and foodstuffs (in 1,000 metric tons):
British imports:
| 1939 | 1940 | 1941 | 1942 | 1943 | 1944 | 1945 | |
|---|---|---|---|---|---|---|---|
| Oil | 11,628 | 11,270 | 13,130 | 16,280 | 14,790 | 20,340 | 15,620 |
| Iron ore (total | 5,200 (=c.54% import) | 4,500 (=c.51% import) | 2,300 (=c.51% import) | 1,900 (=c.30% import) | 1,900 (=c.30% import) | 2,200 (=c.33% import) | 4,100 (=c.48% import) |
| Iron and steel | 1,820 | 3,690 | 4,080 | 2,210 | 2,810 | 1,760 | 314 |
| Scrap iron | 605 | 937 | 549 | - | - | - | 200 |
| Bauxite | 302 | 112 | 87 | 48 | 242 | 172 | 163 |
| Lead (total) | 334 (=c.93% import) | 336 (=c.93% import) | 139 (=c.84% import) | 235 (=c.90% import) | 226 (=c.89% import) | 225 (=c.89% import) | 165 (=c.86% import) |
| Tin (total) | 54 (=c.95% import) | 84 (=c.97% import) | 65 (=c.96% import) | 44 (=c.94% import) | 52 (=c.95% import) | 33 (=c.69% import) | 45 (=c. 94% import) |
| Zinc (total) | 167 (=c.95% import) | 204 (=c.96% import) | 210 (=c.96% import) | 212 (=c.96% import) | 188 (=c.96% import) | 119 (=c.94% import) | 97 (=c.92% import) |
| Raw rubber | 69 | 200 | 168 | 66 | 69 | 34 | 36 |
| OVERALL strategic raw materials (excluding oil) | 3,351 | 5,563 | 5,298 | 2,815 | 3,587 | 2,343 | 1,020 |
| Rice (food) | 143 | 191 | 179 | 53 | 131 | 72 | 25 |
| Peas and beans (food) | 135 | 147 | 158 | 48 | 69 | 71 | 66 |
| Wheat | 5,300 | 5,800 | 5,400 | 3,500 | 3,300 | 2,800 | 3,600 |
| Overall | 25,757 | 27,471 | 26,465 | 24,596 | 23,777 | 27,826 | 24,431 |
Extent of the strategic bombing war, 1940-1945
in tons of bombs dropped:
Year: | 1940 | 1941 | 1942 | 1943 | 1944 | 1945 (4 months) | TOTAL |
|---|---|---|---|---|---|---|---|
on cities in UK | 38,844 | 21,858 | 3,260 | 2,298 | 9,151 | 761 | 76,172 |
on cities in Germany (for comparison) | 10,000 | 30,000 | 40,000 | 120,000 (from Oct-Dec about 15% of failure in arms production) | 650,000 | 500,000 | 1,350,000 |
References and literature
World War II – A Statistical Survey (John Ellis)
Chronology of World War II (Christopher Argyle)
Die Schlacht im Atlantik (Andrew Kershaw)




Some of the small arms figures are far too low GB had nearly 9million troops of various types they did not share rifles indeed allied contingents and the resistance was largely supplied as well
Overall more than 5 Million Lee-Enfield were built, the majority seems to be No.1 Mk III* from World War I. The No.4 Mk I was built from Nov 39 and became not the British standard rifle before Nov 1941 and well over 1 million (plus 100,000 No.5 Mk I and 25,000 No.4 Mk I(T) ) were built during WW2. It looks like many British and Commonwealth troops still were using the older No.1 Mk III* (which was produced in Australia til 1955) or US M1903 and M1917 (secondary units and Home Guard), especially at the beginning of WW2.
Additional, alone between 2 and 3.75 million British Sten sub-machine guns were manufactured during WW2.
The British Army reached its peak strength in June 1944 with 2,920,000 soldiers (plus 190,800 ATS).